All of the graphics procedures in AM allow the user to change their appearance. We can think of the different elements of a graphic--for example, the bars in a bar chart, the axes and labels, plotting symbols, etc. AM associate each type of element with a set of attributes. The attributes can include all or some of the following:
- Text font
- Text color
- Line color
- Line thickness/li>
- Line type--dashed or not, frequency of dashes
- Full color
Each graphic model may define a different set of elements with which the user can associate visual attributes. All graphics use the same input mechanism, though. In general, the input dialog looks something like this:
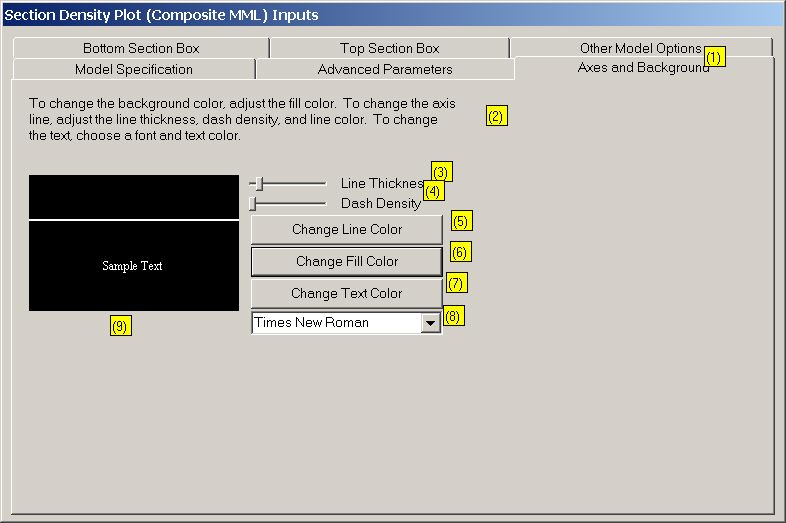
The different parts of the dialog box are numbered in yellow. Each numbered element is described below:
- Label. The tab name gives a short description of the graphic elements to which these attributes will apply
- Description. This text gives a more detailed description or instructions about graphic elements associated with these attributes.
- Line thickness. This slider bar will make the line thicker or thinner.
- Dash density. This slider bar will make the line dashed. When it is all the way to the left, the line is solid. as it moves farther to the right the line becomes dashed with increasingly long and increasingly separated dashes.
- Change line color. This will pop up a color-chooser dialog to select a color for the line.
- Change fill color. This will pop up a color-chooser dialog to select a color for the fill.
- Change text color. This will pop up a color-chooser dialog to select a color for the text.
- Font. Use this drop-down box to select a font for any text in these graphic elements. The system will automatically determine the size of the text.
- Sample display. As you change attributes, this window provides samples of what they look like.
Some visual attributes are not relevant to some graphic elements. For example, bars on a bar chart typically have no text, so there is no reason to specify a font color or font. Therefore, for some elements, some of the choices on dialog box do not appear. Here is an example asking for the fill color for the top box in a sectioned density plot:
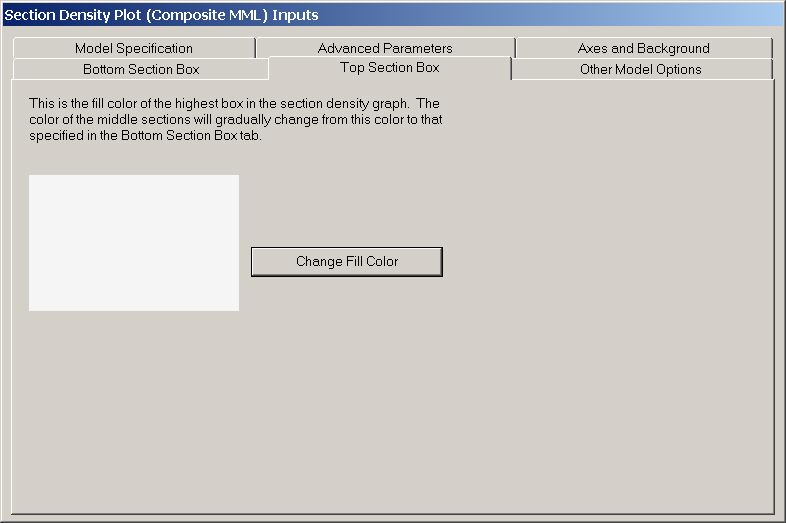
This graphic element has no lines and no text, so those attributes do not appear on the dialog box. Please see the individual graphics for a description of what each element is.