Descriptive statistics are a useful tool to assist analysts in simplifying and reducing the information contained in the sample data to a few descriptive numbers, called sample statistics. They are often used as a preliminary step to further analysis to examine the properties of the data and are helpful in detecting possible data problems (e.g., out-of-range values, skewness of responses). The current descriptive statistics procedure provides the sample mean of a variable with its corresponding standard error, the standard deviation, and the minimum and maximum values. Standard errors and standard deviations are adjusted to take into account the particular features of the sample design.
The descriptive statistics procedure provides information on both the center (i.e., mean) and spread (i.e., standard deviation; minimum; maximum) of a distribution. In addition, it provides a measure of the accuracy of the estimate of the sample mean (i.e., its standard error).
An important measure of central tendency, the sample mean of a variable is simply its average, computed by summing the values of all observations in the sample and dividing by the number of observations. This can be written as:

Although the average may be the most important single statistic, it is also important to know how spread out or varied the observations are. A commonly used measure of spread is the standard deviation. The standard deviation is simply the square root of the variance and provides a standard way to measure the deviation from the mean. In a simple random sample (srs) situation, the variance is the sum of the squared deviations from the mean (squared so that their sum is not equal to zero) divided by n-1 observations (to adjust for the numbers of degrees of freedom). Thus, in srs the standard deviation can be written as:

The above formulation assumes that the selection of elements in the sample is independent of one another. Most large scale surveys, however, employ complex sample design that rely on stratification and/or clustering methods (e.g., as in NAEP) to reduce the cost of administration. These designs violate the assumption of independence of observations (for example, by selecting students in entire classrooms), resulting in a non-zero covariance between the elements included in the sample. In such a situation, the formula for computing the variance (as well as the formula for any statistics using the variance) must be adjusted to take into account the combined effects of stratification, clustering, and the sample weights. This is done through robust variance estimation techniques such as Taylor series expansion or jackknife repeated replication. In the current procedure, the standard deviation is estimated using the Taylor series expansion variance estimation technique.
Additional information on the spread of the observations is provided through the minimum and maximum values of the sample data.
While information about the sample mean is useful in a variety of situations, in itself it says little about the corresponding target population mean it represents. The deviation of the sample mean from its target population mean represents the estimation error and is typically measured by the standard error. The larger the standard error of a sample mean, the less typical is that sample from its corresponding population. The formula for the standard error is:

where s represents the sample standard deviation. Again, to take into account the features of a complex survey design, the estimation of the standard error of the sample mean is based on a Taylor series expansion variance estimation technique.
Wonnacott, T. H., & Wonnacott, R. J. (1984). Introductory Statistics for Business and Economics, 3rd Edition. New York: John Wiley & Sons.
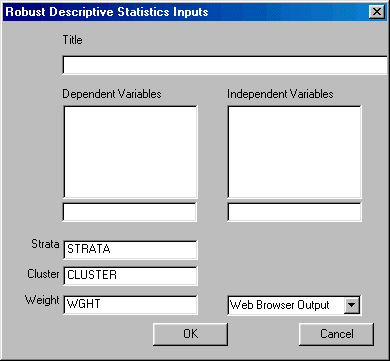
To run Descriptive left-click on the Statistics menu and select "Descriptive." The following dialogue box will open:

Specify the independent variables and the dependent variable. You may also select the desired output format.
When you are finished, click the OK button.
Click the OK button on the Descriptive dialogue box to begin the analysis
Once the analysis is completed, you may perform a correlation or t-tests on the results.