The Percentiles procedure estimates population percentiles. For example, you may be interested in the median (50th percentile) and the lower and upper quartile (25th and 75th percentile). These types of statistics are helpful in exploring and understanding a distribution that is not necessarily symmetric.
This procedure estimates percentiles of the estimated population distribution, rather than the sample distribution. Hence sample weights serve to "expand" the sample, with each observation representing multiple, roughly identical observations. Given that this is an estimate, some uncertainty remains as to the exact value of the population percentile. A standard error is not a particularly useful estimate of this uncertainty, since the uncertainty need not be symetrically distributed around the percentile estimate. Therefore, this procedure reports approximate 95 percent confidence limits around the point estimates.
The percentile procedure begins by sorting the data in ascending order (within groups defined by the independent variables). The sample weights are summed until the designated proportion of the total weight is reached. Usually, this does not land exactly on a sample value, so a linear interpolation is used between the two adjacent sample points.
To obtain the confidence bands, the procedure creates indicator variables indicating whether an observation falls above a designated percentile. The weighted mean of this variable, of course, equals the designated percentile. We the calculate the standard error around this mean (via Taylor-series approximation). Call this standard error s, and let p represent the original target percentile. Assuming that these means are roughly normally distributed, we calculate the lower-bound of the percentile as LB=p-1.96s and the upper-bound of the percentile as UB=p+1.96s. Finally, we traverse the ordered list of values, summing the sample weights as we go, until we reach the designated LB, then UB. Again, we linearly interpolate between sample points as necessary.
Binder, D. A. (1983). On the variances of asymptotically normal estimators from complex surveys. International Statistical Review, 51, 279-292.
Kish, L. (1965). Survey Sampling. New York: John Wiley and Sons.
Särndal, C. E., Swensson, B., & Wretman, J. (1992). Model Assisted Survey Sampling. New York: Springer-Verlag.
To estimate the values that mark the percentile boundaries, begin by selecting the Statistics|Basic Statistics|Percentiles from the main menu. The following dialog box will appear:
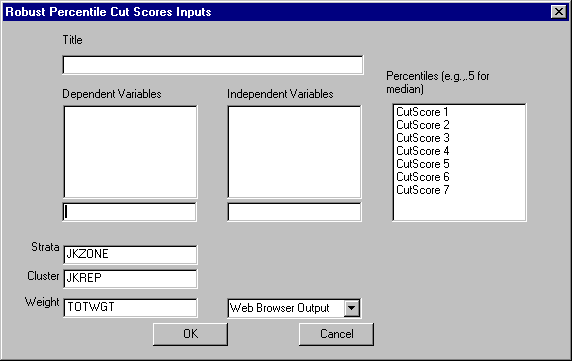
Specify the independent variables and the dependent variable. The procedure will estimate the requested percentiles of the dependent variable for each group defined by the cross-classification of the (categorical) independent variables.
The edit box on the right allows you to enter up to 7 cutscores (percentiles) that you would like to identify. Enter the decimal value of the percentile (for example, enter .5 if you would like the cutpoint for the median, .25 for the lowest 25 percent).
You may also elect to change the design variables, enter the cut scores, and select the desired output format.
When you are finished, click the OK button.