This procedure is simply another form of MML Regression. In this case, the independent variables are assumed to be categorical rather than continuous. This procedure is equivalent to a MML regression in which the cross-classification of all of the independent variables are a separate 1/0 variable for each category (dummy coded). The constant term is suppressed in the regression. This procedure is a convenience for the user, and also takes advantage of some algorithmic improvements to help it run faster.
Two variants of this procedure are available. MML Means assumes that all groups have a common variance. MML Means (Separate Variances) assumes different variances across groups.
This procedure is simply another form of MML Regression. In this case, the independent variables are assumed to be categorical rather than continuous. This procedure is equivalent to a MML regression in which the cross-classification of all of the independent variables are a separate 1/0 variable for each category (dummy coded). The constant term is suppressed in the regression. This procedure is a convenience for the user, and also takes advantage of some algorithmic improvements to help it run faster.
Two variants of this procedure are available. The basic procedure assumes that all groups share the same variance. The MML Means (Separate Variances) procedure estimates a separate mean and variance for each group. Essentially, this is the same as estimating a separate regression with only a constant term for each group; however, the standard errors may covary across groups in complex samples.
Binder, D. A. (1983). On the variances of asymptotically normal estimators from complex surveys. International Statistical Review, 51, 279-292.
Bock, R. D., & Aitkin, M. (1982). Marginal Maximum Likelihood estimation of item parameters: application of an EM algorithm. Psychometrika, 46, 443-459.
Mislevy, R. J., Beaton, A. E., Kaplan, B., & Sheehan, K. M. (1992). Estimating population charateristics from sparse matrix samples of item responses. Journal of Educational Measurement, 29, 133-161.
Mislevy, R. J., Johnson, E. G., & Muraki, E. (1992). Scaling procedures in NAEP. Journal of Educational Statistics, 17, 131-154.
Mislevy, R. J., & Sheehan, K. M. (1987). Marginal estimation procedures. In A. Beaton (Ed.), The NAEP 1983-84 Technical Report (pp. 293 - 360). Princeton, NJ: Education Testing Service.
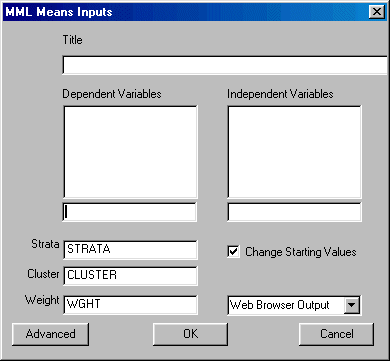
To run MML Means, left-click on the Statistics menu and select "MML Means." The following dialogue box will open:

Specify the independent variables and the dependent variable. You may also elect to change the design variables, change the starting values, suppress the constant, and select the desired output format.
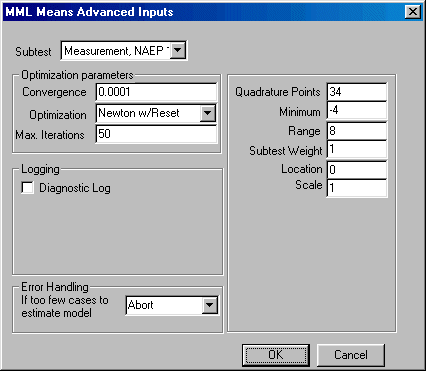
If you wish to change the default values of the program, click the Advanced button in the bottom left corner and the Advanced parameters dialogue box shown here will open:

You may now edit the values for quadrature points, minimum, range, subtest weight, convergence, maximum number of iterations allowed for convergence, and change the default optimization method. You may elect to create a diagnostic log.
When you are finished, click the OK button.
Click the OK button on the MML Means dialogue box to begin the analysis.
Once the analysis is completed, you may perform either predicted values, posteriors, or t-tests on the results.
In NAEP, MML regression models are the models underlying plausible values. To obtain plausible values, NAEP estimates a large MML regression containing every background and contextual variable included in NAEP (known as conditioning variables), plus an additional random component. These marginal estimation procedures circumvent the need for calculating scores for individual students by providing consistent estimates of group or subgroup parameters.