Corresponding to each examinee i, the percent above a cutscore c is:

and the population cut point percent is then

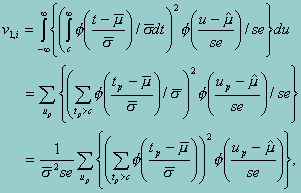
The variance of the above percent estimation can be decomposed into two parts. The first part is due to the uncertainty of the parameter estimation. For each examinee, this part of variance is:

where tp, up are two sets of quadrature points, and se is the standard error of the prior estimate û =  . Thus, the first part of the population variance is the sample mean of the above individual variances. The second part is the sample variance among the estimated individual percent above the cutscore pi,c. In other words, the variance (or standard error) of the estimated cut point percent is: mean(v1,i) + var(pi,c)..
Cohen, J., & Jiang, T. (1998). Composite Assessment Scales and NAEP Analyses. Washington, DC: American Institutes for Research.
To run NAEP Tables left-click on the Statistics Menu and select "NAEP Table." The following dialogue box will open:

Specify the independent variable and the dependent variable. There are several specific requirements for variables when running the NAEP Table. The user may specify only a single, categorical independent variable. A future release will allow the selection of multiple.
This procedure reproduces estimates of percent of students above specified cut scores (e.g. NAEP achievement levels) as presented in NAEP reports.