Many sample designs call for oversampling certain subpopulations to ensure adequate precision in the estimation of characteristics of these subpopulations. Oversampling is particularly important when we wish to obtain good estimates of small subpopulations (e.g., minority groups; resident of extreme rural areas). The result of this oversampling is a sample containing proportionately more members of these subgroups than there are in the population. Appropriate estimation of population characteristics must take this disproportional representation into account. This is accomplished by assigning a sampling weight to each respondent. Sampling weights are needed to make valid inferences from samples to the respective populations from which they were drawn. They adjust for differential sampling rates of subpopulations as well as non-response, and reduce sampling variability.
Appropriate estimation of population characteristics must take disproportionate representation into account. This is accomplished by assigning a weight to each respondent, where the weights approximately account for the sample design and reflect the appropriate proportional representation of the various types of individuals in the population. The computation of sampling weights typically involve the following steps:
- computing the respondent’s base weight,
- adjusting this weight for nonresponse,
- trimming excessively large weights, and
- reducing sampling error through postratification procedures.
Where:
Base weight is the reciprocal of the probability that the respondent was selected for a particular assessment.
Nonresponse adjustment adjust the weights of respondents included in the sample to account for those selected individuals who refused to participate. In the case where the unit of selection is a school, the nonresponse adjustement adjust for school non-response. In multi-stage sample, a non-response adjustment is performed typically at various stages of selection
Trimming is used to eliminate excessively large weights assigned to respondents. Respondents with notably large weights have an unusually large impact on estimates such as weighted means. Since the variability in weights contributes to the variance of an overall estimate, an occasional large weight is likely to produce large sampling variances of the statistics of interest. To reduce this problem, a procedure of trimming a few of the more extreme weights to values closer to the mean weights is used.
Postratification procedures adjust sample estimates of the population in a number of categories of interest (e.g., race, ethnicity, region) to presumably better estimates obtained from other sources (e.g., Current population Survey estimates) or from population data (e.g., Census). This adjustment is intended to reduce the mean squared error of estimates for these population
Kalton, G. (1983). Introduction to Survey Sampling. Sage University Papers 35: Quantitative Applications in the Social Sciences.
Kish, L. (1965). Survey Sampling. New York: John Wiley and Sons.
Lee, E. S., Forthofer, R. N., & Lorimor, R. J. (1989). Analyzing Complex Survey Data. Sage University Papers 71: Quantitative Applications in the Social Sciences.
Wallace, L., & Rust, K. F. (1996). Sample design. In N. Allen, D. L. Kline, & C. A. Zelenak (Eds.), The NAEP 1994 Technical Report (pp. 69-86). Washington, DC: U.S. Department of Education.
NAEP uses differential sampling rates, deliberately oversampling certain subpopulation to obtain larger sample of respondents from those subgroups, thereby enhancing the precision of estimates of characteristics of these oversampled subgroups. As a result of this oversampling, appropriate sampling weights must be computed to obtain unbiased estimates of population characteristics. These weighting procedures involve computing a student base weight, performing various adjustment for nonresponse, trimming excessively large weights, and adjusting these weights through poststratification procedures.
Student Base Weight
The NAEP student base weight assigned to a student is the reciprocal of the probability that the student was selected for a particular assessment. That probability is the product of four factors:
- the probability that the PSU was selected;
- the conditional probability, given the PSU, that the school was selected;
- the conditional probability, given the sample of schools in a PSU, that the school was allocated the specified assessment; and
- the conditional probability, given the school, that the student was selected for the specified assessment.
Nonresponse Adjustment Factor
NAEP uses two nonresponse adjustment factors: one to adjust for sessions that were not conducted, either because a school refused or because a school failed to conduct all of its assigned sessions, and one to adjust for students who were selected to take the assessment but did not show up. The nonresponse adjustment factor is the product of these two factors.
In PSU h, the session nonresponse adjustment factor SESNRFh is given by:
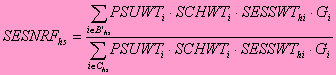
Where
| |
PSUWT i |
= the PSU weight for the PSU containing school i; |
| |
SCHWTi |
= the school weight for school i; |
| |
SESSWThi |
= the session allocation weight for school i for session h; |
| |
Gi |
= the estimated number of age-plus grade-eligible students in school i in the case of print-administered sessions, and the estimated number of age-eligible students in the case of the tape-administered sessions, to which only age eligibles were invited (the values of Gi were based on QED data); |
| |
set B'hs |
= consists of all in-scope originally sampled schools allocated to sessions in subuniverse s (excluding substitutes); and |
| |
set C hs |
= consists of all schools allocated to session h in subuniverse s that ultimately participated (including substitutes). |
For each class c in assessment g in session h, the student nonresponse adjustment factor STUNRFghc is computed by:
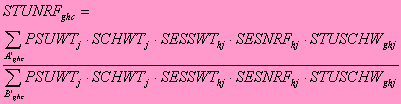
where
| |
PSUWTj |
= the PSU weight for the PSU containing school j; |
| |
SCHWTj |
= the school weight for school j; |
| |
SESSWThj |
= the session allocation weight for school containing student j; |
| |
SESNRFhj |
= the session nonresponse adjustment factor for the school containing student j; |
| |
STUSCHWghj |
= the within-school student weight for student j in session h in assessment g; |
| |
set A’ghc |
= consists of the students in class c who were sampled for assesment g in section h and not excluded; and |
| |
set B’ghc |
= consists of the students in class c who were assessed in assesment g in section h. |
Trimming of Weights
Students with excessively large weights have an unusually large impact on estimates, possibly producing large sampling variances of the statistics of interest. To reduce this problem and increase the accuracy of survey estimates NAEP uses a trimming algorithm that trims the weights of students from any school that contributed more than a specified proportion, H, to the estimated variance of the estimated number of students eligible for assessment. In each case, the value of the proportion H is chosen to be 10/K, where K is the number of schools in which a specified assessment is conducted.
Poststratification Procedures. To further reduce uncertainty in the estimates due to sampling variability, NAEP adjusts sample estimates of the population in a number of race, ethnicity, and region categories using presumably better estimates from the Current population Survey (CPS). The poststratified weight for each student within a particular category is the student’s base weight, with adjustments for nonresponse and trimming, time a poststratification factor. For each category, the poststratification factor is a ratio of the CPS estimate of the total number of students in the population who are member of the category, over the sum of the weights of assessed and excluded students.
Final Student Sample Weight.
The final weight assigned to a student is the student’s base weight after the application of the various adjustments described above. These sample weights are used to derive all estimates of population and subpopulation characteristics that are presented in various NAEP reports.