The frequencies procedure estimates the number and proportion of units in a population (i.e., people in a human population) that have each of a set of mutually exclusive characteristics. For example, you may use it to estimate the proportion of a population that is male and female, or the proportion who said yes, no, and maybe to a question on a survey.
Estimates may be presented for groups within the population, for example, the gender distribution may be obtained separately for upper, middle, and lower income people.
AM presents freqencies with the categorical dependent variable in the columns of the table. By default, the cells of the table present row percentages. This procedure actually estimates the total within each cell of the, and tranforms the results to row percentages.
The row percents are calculated by dividing each cell in the row by the sum of the row.
The standard errors of the row percents are calculated from the variance/covariance matrix of the total frequencies. Note that the row percentages may be considered ratios of two population totals--the total for the cell in the numerator, and the total for the row (the sum of the cells) in the denominator.
We can specify these each ratio as the solution to the following estimating equation involving population totals

Using the a general, first-order Taylor-series estimate of the variance of estimates from this estimating equation, we have

where p is the vector of proportions, f is a vector of k cell frequencies, N is the estimated row total
The kxk covariance matrix for the cell frequency estimates is estimated by the totals procedure. The variance of the estimated row total (N), along with its covariances with the frequency estimates, can be calculated from these estimates. We begin by augmenting var(f) with an extra row and column for N. To do so, define the kxk+1 design matrix D, which has the following form:

The augmented variance matrix is given by

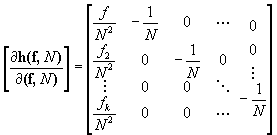
The derivative matrix for k proportion estimates from k+1 parameter estimates takes a similar form, where

The resulting matrix estimates the sampling variance of the estimated proportions
Binder, D. A. (1983). On the variances of asymptotically normal estimators from complex surveys. International Statistical Review, 51, 279-292.
Godambe, V. P., & Thompson, M. E. (1986). Parameters of superpopulation and survey population: Their relationships and estimation. International Statistical Review, 54, 127-138.
Kish, L. 1965. Survey Sampling. New York: Wiley and Sons.
Särndal, C. E., Swensson, B., & Wretman, J. (1992). Model Assisted Survey Sampling. New York: Springer-Verlag.
Wolter, K. 1985. Introduction to Variance Estimation. New York: Springer Verlag.
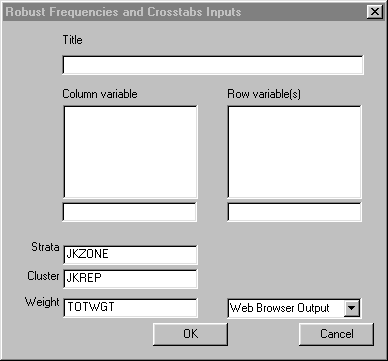
To run Frequencies left-click on the Statistics menu and select "Frequencies." The following dialogue box will open:

Specify the independent variables and the dependent variable. The dependent variable will be displayed in the columns, and should be a categorical variable. The independent variables, if any, should also be categorical variables.
When you are finished, click the OK button.
Click the OK button on the Frequencies dialogue box to begin the analysis
Once the analysis is completed, you may perform a t-tests on the results.