Large-scale assessments typically cover domains with multiple sub-domains. For example, a reading test might include two scales: reading for literary experience and reading for information. These scales, measured indirectly through the test items and background variables, are assumed to be correlated (though not perfectly) with one another, and conceptually distinct. A summary measure of one’s reading performance is formed as a weighted average of these two scales. These summary scales are known as composite scales.
Procedures developed to accommodate the analysis of composite scales are based on either numerical integration or an approximation to the integrals (Thomas, 1993), and prove dauntingly slow. MML composite regression develops an extremely efficient alternative procedure for the analysis of composite scales that does not require more than two-dimensional numerical integration or a complex approximation, resulting in a computationally very fast algorithm that does not sacrifice statistical efficiency.
Regression parameters for composite scales are typically obtained through some simultaneous estimation procedures, or through separate estimation for each scale and estimation of the pairwise correlations. The former procedure is usually preferred on the grounds that higher-order integration yields efficiency gains. In simultaneous estimation, calculating the marginal maximum likelihood statistics requires integrating over one dimension for each subscale on the assessment. Such numerical integration becomes intractable when more than three or four dimensions exist.
To address this problem, Thomas (1993) proposed a Laplace approximation to the integrals that solved many of the difficulties associated with the integrated normal approximation. While this approach, which remains in use today, is dramatically faster than numerical integration, it is still dauntingly slow due to the many iterations (100 or more) required to reach convergence by the EM algorithm.
Cohen and Jiang (1998) have shown that the multidimensional integration that poses the computational problem is unnecessary. The composite scale situation is analogous to a Seemingly Unrelated Regressions (SUR) model-a model that provides no more efficient estimates when regressions including identical regressors are estimated simultaneously than when they are estimated separately (Greene, 1993). In other words, no efficiency is gained by doing a GLS estimation, which usually results in more computing steps and more time needed to obtain the results. Based on this principle MML composite regression develops a two-stage approach to obtain robust parameter estimates in a composite scale situation.
In the first stage, a one-dimensional marginal maximum likelihood estimation procedure is applied to each sub-scale separately to obtain the regression coefficients and associated standard errors of each sub-scale. These results are used to infer the conditional mean and variance of each sub-scale. In the second stage, a two-dimensional marginal estimation procedure is used to compute the covariance between each pair of scales.
We start from a multivariate multiple regression model with p latent variables representing proficiency or scale in several closely related subjects. For a sample of n examinees, the proficiency variables corresponding to examinee i, denoted by 2i = qi1,...,qip)', is modeled by a multivariate normal distribution. The variable 2i is not measured directly, but information about 2i is obtained from several examination items given to each examinee, and denoted by zi . Thus, the likelihood function for the marginal maximum likelihood estimate can be written as

where qi is the proficiency variable corresponding to the ith examinee, xI is the vector of independent variables, B and G are the parameters. It is clear that the above likelihood function is a product of two separate functions. The first function is the probability that an examinee with a proficiency level qi produces the observed item response zi. According to item response theory (IRT), this probability is simply a product of the probabilities of the observed item response corresponding to each of the p scales conditional on the associated proficiency qi, or,

We can, therefore, consider the single-scale probability, instead of the total probability.
The second part of the likelihood function is the probability that an examinee with specific proficiency qi will be sampled from the population. As in most situations, we assume that this probability has a normal distribution. Since we have multivariate scales, this distribution is a multivariate normal distribution. However, for a multivariate normal distribution, the marginal distribution of each scale is a univariate normal distribution. Corresponding to each scale, the likelihood function will assume the same form as the one taken by the single-scale problem. The MML technique, thus, can be used directly to estimate the mean or the regression coefficients, with standard deviations of each scale. In other words, maximum likelihood estimates are obtained for each scale based on the following likelihood function:

Once the mean and standard deviation are obtained for each sub-scale, the only parameters left are the covariances between the sub-scales. To estimate the covariance matrix is equivalent to estimating the covariance between each pair of the sub-scales. Of the p scales, there are a total of (p-1)p/2 pairs of covariances that need to be estimated. For a particular pair of scales, denoted by q1,q2) , the likelihood function, based upon the estimated parameters from stage 1, is given by


A two-dimensional marginal maximum likelihood estimation procedure, therefore, can be applied to obtain the estimate of q12, which remains tractable no matter the numbers of the sub-scales.
Cohen, J., & Jiang, T. (1998). Composite Assessment Scales and NAEP Analyses. Washington, DC: American Institutes for Research.
Greene, W. H. (1993). Econometric Analysis, (2nd Edition). New York: Macmillan Publishing Company.
Mislevy, R. J. (1991). Randomization-based inference about latent variables from complex samples. Psychometrika, 56, 177-196.
Rubin, D. B. (1987). Multiple Imputation for Nonresponse in Surveys. New York, NY: Wiley.
Thomas, N. (1993). Asymptotic corrections for multivariate posterior moments with factored likelihood functions. Journal of Computational and Graphical Statistics, 2, 309-322.
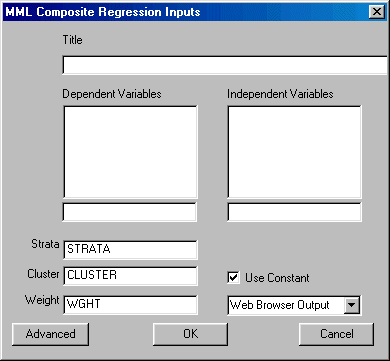
To run MML Composite Regression left-click on the Statistics Menu and select "MML Composite Regression." The following dialogue box will open:

Specify the independent variable and the dependent variable. Note that the dependent variable is composed of multiple subtests from the same test. By default, all subtests are equally weighted. The advanced options allow users to change these weights. You may also elect to change the design variables, suppress the constant, and select the desired output format.
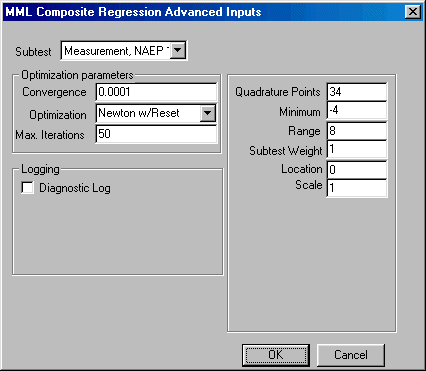
If you wish to change the default values of the program, click the Advanced button in the bottom left corner and the Advanced parameters dialogue box shown here will open:

You may now edit the values for quadrature points, minimum, range, subtest weight, convergence, subtest, and change the default optimization method.
When you are finished, click the OK button.
Click the OK button on the MML Composite Regression dialogue box to begin the analysis.
Once the analysis is completed, you may perform correlations among equations or t-tests on the results.
In NAEP many assessment domains are composed of multiple subscales. For example, the reading test includes two subscales: reading for literary experience and reading for information; The math test includes five subscales. The NAEP plausible values have been designed to support analysis of composite scales based on Thomas’ (1993) approximation to the integrals over multiple dimensions-one for each subscale.