Multinomial logit is a discrete choice model. In econometrics, it is often used to model the choice among mutually exclusive alternatives. The choice among alternatives is modeled as a function of some independent variables. The multinomial logit model builds in the assumption that the choice between any pair of alternatives is independent of the availability of other alternatives. This can be a substantial limitations if the choices really are not independent.
The variant of multinomial logit in AM can be used to model influences on the precision of choices, as well as the choices themselves. For example, a political scientist may want to model vote choice as a function of attitudes. In this example, you might expect a greater effect of attitudes on vote choice among the best informed voters. The generalized multinomial logit model in AM allows you to model the influences on choices as well as influences on the degree of uncertainty in those choices.
While there are many ways to motivate the multinomial logit model, perhaps the best known is the random utility model. In this model, each individual's utility for each choice is a function of systematic influences and some random influences. Individual i's utility from choice j can be specified as ![[Graphics:Images/HetMNLogitWriteup_gr_1.gif]](/portals/0/Manual/Captures/HetMNLogitWriteup_gr_1.gif) Individual i chooses option j if
Individual i chooses option j if ![[Graphics:Images/HetMNLogitWriteup_gr_2.gif]](/portals/0/Manual/Captures/HetMNLogitWriteup_gr_2.gif) .
.
McFadden (1973) has shown that if v is distributed with a type 1 extreme value distribution, with ![[Graphics:Images/HetMNLogitWriteup_gr_3.gif]](/portals/0/Manual/Captures/HetMNLogitWriteup_gr_3.gif) , the multinomial logit model results.
, the multinomial logit model results.
The generalized variant in AM specifies ![[Graphics:Images/HetMNLogitWriteup_gr_4.gif]](/portals/0/Manual/Captures/HetMNLogitWriteup_gr_4.gif) If no variables are specified, or (in the limit) if the specified variables have no effect on precision,
If no variables are specified, or (in the limit) if the specified variables have no effect on precision, ![[Graphics:Images/HetMNLogitWriteup_gr_5.gif]](/portals/0/Manual/Captures/HetMNLogitWriteup_gr_5.gif) The exponential specification here is, in part, a computational convenience, designed to offer a smooth curve with lower asymptote of zero.
The exponential specification here is, in part, a computational convenience, designed to offer a smooth curve with lower asymptote of zero.
The probability of individual i selecting option 2 over option 1 is given by
![[Graphics:Images/HetMNLogitWriteup_gr_6.gif]](/portals/0/Manual/Captures/HetMNLogitWriteup_gr_6.gif) )=
)=![[Graphics:Images/HetMNLogitWriteup_gr_7.gif]](/portals/0/Manual/Captures/HetMNLogitWriteup_gr_7.gif)
Defining ![[Graphics:Images/HetMNLogitWriteup_gr_8.gif]](/portals/0/Manual/Captures/HetMNLogitWriteup_gr_8.gif) , υ is distributed according to a logistic distribution, which has a mean of zero and a standard deviation of
, υ is distributed according to a logistic distribution, which has a mean of zero and a standard deviation of
![[Graphics:Images/HetMNLogitWriteup_gr_9.gif]](/portals/0/Manual/Captures/HetMNLogitWriteup_gr_9.gif)
![[Graphics:Images/HetMNLogitWriteup_gr_10.gif]](/portals/0/Manual/Captures/HetMNLogitWriteup_gr_10.gif)
The probability of individual i choosing option j is given by ![[Graphics:Images/HetMNLogitWriteup_gr_11.gif]](/portals/0/Manual/Captures/HetMNLogitWriteup_gr_11.gif)
The likelihood function for the model is given by
L=![[Graphics:Images/HetMNLogitWriteup_gr_12.gif]](/portals/0/Manual/Captures/HetMNLogitWriteup_gr_12.gif) where
where ![[Graphics:Images/HetMNLogitWriteup_gr_13.gif]](/portals/0/Manual/Captures/HetMNLogitWriteup_gr_13.gif)
The first derivatives of the log likelihood are necessary for estimation. Those derivatives are given by
![[Graphics:Images/HetMNLogitWriteup_gr_14.gif]](/portals/0/Manual/Captures/HetMNLogitWriteup_gr_14.gif) and
and
![[Graphics:Images/HetMNLogitWriteup_gr_15.gif]](/portals/0/Manual/Captures/HetMNLogitWriteup_gr_15.gif) .
.
While the second derivatives are not too complicated, the model may be estimated using the score product matrix in place of the information matrix, which is fast and accurate.
Like the standard multinomial logit model, this model has an indeterminacy of scale, which is addressed without loss of generality by specifying ![[Graphics:Images/HetMNLogitWriteup_gr_16.gif]](/portals/0/Manual/Captures/HetMNLogitWriteup_gr_16.gif) . The usual interpretation of the coefficients as the linear effect on the log-odds ratio can only be applied for a fixed value of z.
. The usual interpretation of the coefficients as the linear effect on the log-odds ratio can only be applied for a fixed value of z.
Converted by Mathematica December 28, 2002
Maddala, G. S. (1983) Limited Dependent and Qualitative Variables in Econometrics Cambridge: Cambridge University Press.
McFadden, D. (1973) "Conditional logit analysis of qualitative choice behavior," in P. Zarembka, ed., Frontiers in Econometrics, New York: Academic Press.
To run the generalized multinomial logit model left-click on the Statistics menu and select "Basic Statistics| Multinomial Logit." The following dialogue box will open:
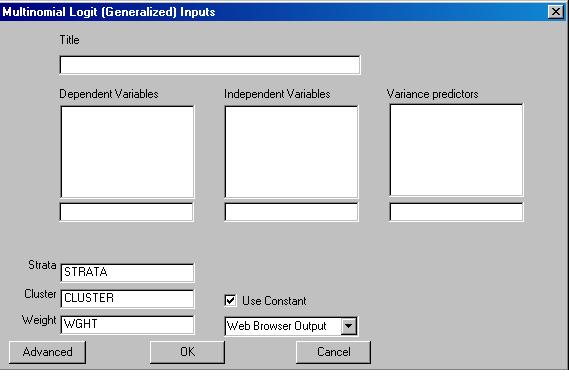
Specify the independent variable and the dependent variables . This variant of the multinomial logit model allows you to model the precision of the predictions as well as the predictions themselves. If your model includes such specifications, add the variables that predict the precision of the predictions to the "variance predictors" box. Note that the variance predictors never include a constant term.
As explained in the "Details" page, the variance is specifed as in an exponential form. If you prefer a linear form, include the log of your variable, rather than the variable itself. This requires that your variable only take on positive values.
You may also select the desired output format.
Click the OK button to begin the analysis. Once the analysis is completed, you may perform a t-tests and other post-hoc procedures on the results.